Showing posts with label JMETER. Show all posts

JMETER - change the server name of the request dynamically

Problem


Tell me, please, what and in what way I should use logic controllers to solve the task (for example):- make 16 requests so that first 3 of them reach one host and each 4-th request is sent to another host (e.g. 3 - first.com; 1 - second.com; 3 - first.com; 1 - second.com and so on). 


Solution

1. add the thread group to the plan with 4 users


2. Add 1 user defined variable called index
Set the default value to 1.


3. Add a while controller

Set the condition to the controller so that it iterates while index < 5.


4. Add 1 HTTP sampler

Leave all fields empty.
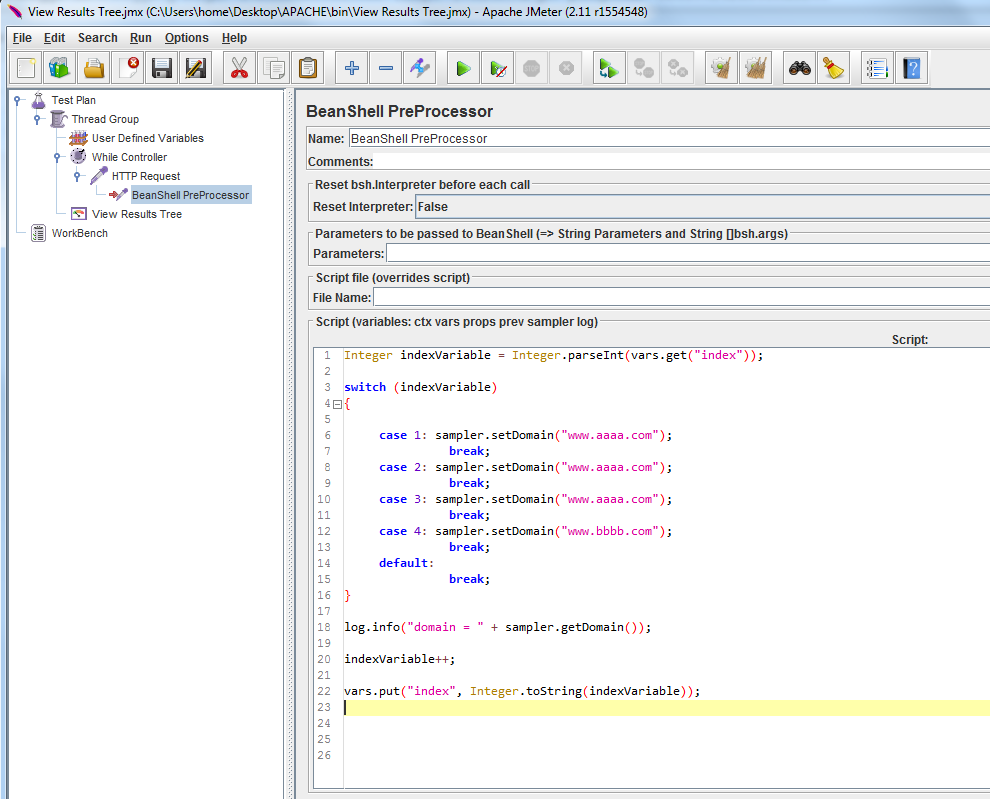
The server name (domain) will be set in a BeanShell pre-processor.


5. Add a BeanShell pre-processor

It runs before the HTTP sampler runs and sets the server name of the HTTP sampler based on the value of the index variable.

The index value is increased after the domain name is set


6. Add a View Results Tree listener


7. Enable the log and run the load test

You will see 16 requests in the listener (4 users x 4 requests per user) and 16 domains in the log (12 for www.aaa.com and 4 for www.bbb.com)


Using Config Elements in a JMETER test plan

The test plan will be very simple and consist in sending requests for the VPL.CA results page using different sort orders of results.

The typical URL of a results page of the site is

http://vpl.bibliocommons.com/search?q=java&t=keyword

where 

t parameter shows that the url corresponds to a keyword search and 
q parameter has the value of the search keyword


After sending this request to the server, if the page loads correctly, 10 or 25 results are loaded.

If the sort order is modified, the URL of the page becomes

Relevance sort order

http://vpl.bibliocommons.com/search?q=java&t=keyword
&sort[field]=RELEVANCY&sort[type]=CATALOG_SEARCH_FIELDS&sort[direction]=descending

Date Acquired

http://vpl.bibliocommons.com/search?q=java&t=keyword
&sort[field]=NEWLY_ACQUIRED&sort[type]=BIB_FIELDS&sort[direction]=descending

Title

http://vpl.bibliocommons.com/search?q=java&t=keyword
&sort[field]=TITLE&sort[type]=BIB_FIELDS&sort[direction]=ascending

Author

http://vpl.bibliocommons.com/search?q=java&t=keyword
&sort[field]=AUTHOR&sort[type]=BIB_FIELDS&sort[direction]=ascending

Published date

http://vpl.bibliocommons.com/search?q=java&t=keyword
&sort[field]=PUBLISHED_DATE&sort[type]=BIB_FIELDS&sort[direction]=descending

All sort urls start with the base URL (http://vpl.bibliocommons.com/search?q=java&t=keyword) and are different in the last part.

So, the JMETER project starts with creating the thread group and the http request:


The first Config Element to be used is HTTP REQUEST DEFAULTS element.

Any http request fields populated in this element can be empty in the actual request as they are "inherited" from the HTTP REQUEST. In our case, just the Server Name or IP is used:

Next, we will change the q parameter of a URL in a variable so that each request uses a different keyword value.

This is done by adding another config element, CSV DATA Set Config that reads the keyword values from a text file:


Each http request will get a value from the CSV Data Set Config through the keywordValue variable.

The http request will look a bit different now:


Next, the http request will be changed again so that the sort order is used.

First, I will add 2 new config elements to the plan: random variable and user defined variables.


The random number will have a value between 1 and 100 generated and stored in the randomNumber variable.

2 user defined variables are created as well:


I will use these config elements as follows:

if (randomNumber between 0 and 20)
sortOrder = "Relevance";

if (randomNumber between 20 and 40)
sortOrder = "acquired";

if (randomNumber between 40 and 60)
sortOrder = "Title";

if (randomNumber between 60 and 80)
sortOrder = "Author";

if (randomNumber between 80 and 100)
sortOrder = "Published";


A BeanShell sampler will determine the sort order. 
The BeanShell sampler will

- get the randomNumber variable value

- convert it from String to Integer

- set local variables with the sort order name and sort order parameters based on the random Number value

- set the user defined variables based on the local variables

- write the sort order name and the sort order parameters to the JMETER log


The http request will now have an updated value:

/search?q=${keywordValue}&t=keyword&${sortOrderParameter}


The http request needs a few assertions:

1. check that the number of books in the page is greater than 0


2. check that the selected sort order is the one defined in the bean shell sampler


I have also added an XPATH extractor to get the number of results in the page and another Bean Shell post-processor to display this value in the log:


It is time to run the project and look at the results:


The last 3 config elements to be added are:


HTTP Cache Manager


It allows clearing the cache for each iteration or setting the cache expiration settings.


HTTP Cookie Manager


It allows clearing the cookies after each iteration or setting cookies.


HTTP Header Manager


It allows changing the request headers so that the requests are sent using a specific browser info (Chrome).

Threads, http requests, assertions, listeners

This article is all about practice.

The most important components of a JMETER test plan are:

- thread groups

- samplers (requests)

- assertions

- config elements

- logic controllers

- listeners


There are lots of good info on each of them on the JMETER user manual.

I don't intend explaining what they do but how they can be used in a simple project.


The load test will cover one of the pages of the autotrader.ca website with the URL

http://wwwa.autotrader.ca/cars/on/toronto/?prx=100&prv=Ontario&loc=toronto&sts=New-Used&hprc=True&wcp=True

The page purpose is to display car ads that belong to sellers from Toronto and 100 kms around Toronto and have the status used or new.

The following load test plan is for educational purposes only and since it uses a live site, it will include a small number of concurrent users (maximum 5).


This is what the test plan will try to achieve:

- use a few concurrent users

- create a HTTP request for the page

        1. add delay after the HTTP request

        2. follow redirects for the HTTP request

        3. get embedded requests; filter embedded requests by the host name

        4. add a few assertions; apply them to the request, redirects and embedded requests


- display the load test results in a viewer

        1. view the request header

        2. view the response header

        3. view the response data

- save the load test results in a file

- parameterize the HTTP request by using variables for most of the parameters from the query string; read the values of the variables from a text file

- troubleshoot the load test results by writing request information to the log


VIDEO link

Please download the video on your computer if the quality is not good when viewing through the browser.


Browser request/server response, GET & POST requests

Some of the most important concepts in JMETER are 

- HTTP request
- request header
- response header
- response data

Before using them in a project, a few details for each is needed.

Browser Request - Server Response 

Most of the user interactions with a website through a browser results into a HTTP request sent to the web server.

Example:

     1. open the browser

     2. open a web page

     3. interact with the web page

     4. the page changes:

- a part of the page changes

- the page is reloaded

- a new page is loaded


Every time the page changes, the browser sends a HTTP request to the server.

The server generates the new page and sends the new page as a response to the browser.

The browser renders the new page for the user.


A HTTP request has the following template:


HTTP request types: GET and POST


Two commonly used HTTP methods are:

GET request   - Used for requesting data from the web server

POST request - Submits data to be processed to a web server


The GET Method

Query strings (name/value pairs) are sent in the URL of a GET request:

       GET /test/demo_form.asp?name1=value1&name2=value2

Characteristics of GET requests:

1. GET requests can be cached

2. GET requests remain in the browser history

3. GET requests can be bookmarked

4. GET requests should never be used when dealing with sensitive data

5. GET requests have length restrictions

6. GET requests should be used only to retrieve data


The POST Method

Query strings (name/value pairs) are sent in the HTTP message body of a POST request:

        POST /test/demo_form.asp HTTP/1.1
        Host: demo.com
        name1=value1&name2=value2

Characteristics of POST requests:

1. POST requests are never cached
 
2. POST requests do not remain in the browser history

3. POST requests cannot be bookmarked

4. POST requests have no restrictions on data length


BROWSER REQUEST


The following info is included in a browser request in the request header:

- request type: GET/POST

- protocol type and version (HTTP)

- URL: hostname + URI 

        http://wwwa.autotrader.ca/cars/bc/vancouver/?prv=BC&loc=vancouver&prx=100

request type = GET
protocol type = HTTP
port = 80
hostname = wwwa.autotrader.ca
URI = cars/bc/vancouver/?prv=BC&loc=vancouver&prx=100
        Query String = prv=BC&loc=vancouver&prx=100


- client:

accept: text/html, application /xhtml+xml, .....
accept encoding: gzip, deflate, .....
accept language: en-US, en
user agent: Mozilla/5.0, apple webkit, chrome, safari

        The user agent depends on the browser type and device type:
  1. FirefoxMozilla/5.0 (Windows NT 6.1; WOW64; rv:32.0) Gecko/20100101 Firefox/32.0
  2. Internet ExplorerMozilla/4.0 (compatible; MSIE 8.0; Windows NT 6.1; WOW64; Trident/4.0; SLCC2; .NET CLR 2.0.50727; .NET CLR 3.5.30729; .NET CLR 3.0.30729; .NET4.0C; .NET4.0E)
  3. ChromeMozilla/5.0 (Windows NT 6.1; WOW64) AppleWebKit/537.36 (KHTML, like Gecko  Chrome/38.0.2125.104 Safari/537.36
  4. Nexus 7 tabletMozilla/5.0 (Linux; Android 4.3; Nexus 7 Build/JSS15Q) AppleWebKit/537.36 (KHTML, like Gecko)   Chrome/29.0.1547.72 Safari/537.36
  5. Iphone 6 smartphoneMozilla/5.0 (iPhone; CPU iPhone OS 8_0 like Mac OS X) AppleWebKit/600.1.3 (KHTML, like Gecko) Version/8.0 Mobile/12A4345d Safari/600.1.4


- cookies info

- transport:

connection info: keep alive
host name


WEB SERVER RESPONSE

The web server response has 2 parts:


Response Data

       Page content sent by the web server to the browser


Response Header

HTTP/1.1 200 OK

Server: nginx/1.1.19

Date: Wed, 22 Oct 2014 18:21:19 GMT

Content-Type: text/html;charset=utf-8

Cache-Control: max-age=0, private, must-revalidate

Set-Cookie: agency_id=BC-VANCOUVER; path=/

Set-Cookie: language=en-CA; path=/; expires=Tue, 22-Oct-2019 18:21:18 GMT

Set-Cookie: page_size=10; path=/; expires=Thu, 22-Oct-2015 18:21:18 GMT

Set-Cookie: SRV=app09; path=/; domain=.bibliocommons.com

Cache-control: private

Age: 1

Connection: close


PRACTICE BY YOURSELF


The easiest way of getting familiar with the concepts from this post is through a web proxy 
like FIDDLER 2.

You can download it from http://www.telerik.com/fiddler.

After downloading it, install the app and start it.

You will see in FIDDLER2 all web requests captured from all open browsers.

You can get access to lots of information about web requests in FIDDLER 2 in just a few 
minutes:

- requests embedded in the web page that corresponds to a web request (URL)


- request header


- response header and response data


JMETER introduction

JMETER is a tool that can used for load testing various types of applications:

  1. web sites
  2. database servers
  3. ftp servers
  4. web services
  5. other apps

It is an open source project born as an Apache project. 

The application is written in Java and can be run on Windows, Mac and Linux.

It has a multi-threaded architecture so that it can run requests on concurrent threads.

The interface is GUI based but it is not very user friendly because the app was created with the focus on technical functionality and not so much on user experience.


JMETER is not a browser since it  operates at the HTTP protocol level.

JMETER does not do the following:
  1. it does not open a browser (most of the time :); it is possible to run Web Driver scripts in JMETER but that's a different discussion))
  2. it does not perform actions supported by a browser
  3. it does not render html pages
  4. it does not execute JAVASCRIPT code embedded in html pages


Because it works at the HTTP protocol level, it simulates almost everything that a browser does because most of the browser actions generate HTTP requests.

It does not generate real users (like Web Driver) but virtual users.


JMETER works with requests (HTTP requests for web sites):

- a request is created in JMETER

- the request is sent to the server


- the server sends the request response back


- JMETER uses the request response by running different assertions


The requests can be sent directly from JMETER to the target system or a master - slave architecture can be used where:

- the master JMETER server creates the requests
- the master JMETER server sends the requests to the slave JMETER server
- the slave JMETER server sends the requests to the target server


Some of the functionality that make JMETER very different from other tools (Load Runner) are

  1. the plug-in interface: Java plug-ins can be added to Jmeter
  2. extensive API (lots of classes and methods that can be used in load test plans)
  3. can run Selenium Web Driver test scripts


The test plans can either be created manually from scratch or be started using the recording module. 

When using the recorder, the browser needs to be configured with JMETER acting as proxy so that all web requests executed in the browser are recorded.


The weak points of JMETER are the reporting and the lack of enterprise support.

There are multiple reporting components out of the box but they are not sophisticated enough.

Great reporting and enterprise features are available from Blazemeter which implements JMETER in the cloud.


Load Testing with JMETER - introduction

Load testing is the process of applying load to an application to see if it can perform as intended under normal conditions.

It is normally done with specialized tools like Load Runner or JMeter.

This type of testing is much more complex than manual testing or even test automation as it requires very diverse knowledge and skills.

The performance tester should have good understanding of not only the application under test but also of 

- http protocol, web requests and responses

- server configuration and monitoring

- scripting

- regular expressions

- log parsing

- application analytics

etc


Some performance testing theory is useful to see the big picture.

The following info has been borrowed from the following free, online resource:
Performance Testing Guidance for Web Applications


Purpose of performance testing


  • Apply normal load to an application to see if it can perform as intended under normal   conditions
  • Ensures that a given function, program, or system can simply handle what it’s designed to handle
  • Related to Stress Testing: overload things until they break, applying unrealistic or unlikely load scenarios
  • Measures:

1. response times

2. throughput rates

3. resource-utilization levels

4. identify your application’s breaking point


 Approach for performance testing

1.Identify the Test Environment


    • Identify the physical test environment and the production environment as well as the tools and resources available to the test team.
    • Physical environment:
      • Hardware
      • Software
      • Network configurations


2. Identify Performance Acceptance Criteria


      • the response time (user concern)
      • throughput (business concern)
      • resource utilization goals and constraints (system concern)


3. Plan and Design Tests


    • key scenarios
    • determine variability among representative users
    • how to simulate that variability
    • define test data
    • establish metrics to be collected. 


4. Configure the Test Environment, Tools and Resources

Ensure that the test environment is instrumented for resource monitoring.


5. Implement the Test Design

Develop the performance tests in accordance with the test design.


6. Execute the Test


    • Run and monitor your tests
    • Validate the tests, test data, and results collection
    • Execute validated tests while monitoring the test and the test environment.


7. Analyse Results, Report, and Retest

    • Consolidate and share results data
    • Analyse the data both individually and as a cross-functional team
    • Re-prioritize the remaining tests and re-execute them as needed
    • When all of the metric values are within accepted limits, none of the set thresholds have been violated, and all of the desired information has been collected, you have finished testing that particular scenario on that particular configuration.


Why Do Performance Testing?


  • Assessing release readiness
    • Helps estimating the performance characteristics of an application
    • Helps determining if an application is capable of handling future growth
  • Providing data indicating the likelihood of user dissatisfaction with the performance characteristics of the system.
  • Assessing infrastructure adequacy
    • Evaluating the adequacy of current capacity
    • Determining the acceptability of stability
    • Determining the capacity of the application’s infrastructure, as well as determining the future resources required
  • Assessing adequacy of developed software performance
    • Determine the application’s desired performance characteristics before and after changes to the software.
    • Provide comparisons between the application’s current and desired performance characteristics.
  • Improving the efficiency of performance tuning
    • Analyzing the behavior of the application at various load levels
    • Identifying bottlenecks in the application
    • Providing information related to the speed, scalability, and stability of a product prior to production release

Baselines


    • Process of running a set of tests to capture performance metric data for the purpose of evaluating the effectiveness of subsequent performance-improving changes to the system or application. 
    • A critical aspect of a baseline is that all characteristics and configuration options except those specifically being varied for comparison must remain invariant.
    • A baseline can be created for a system, component, or application. 
    • A baseline can set the standard for comparison, to track future optimizations or regressions.  


The load testing tools are operating differently from browsers and test automation tools.

They are 

- not browsers

- do not perform all actions supported by browsers

- do not render html pages

- do not execute javascript code included in the html pages

- work at the protocol level (http protocol for web sites), submit web requests to the web server and then process the response from the server.


Most of the load testing tools work for multiple protocols so they can test

- web sites

- database systems

- web services

- client-server apps


Usually, the following components will be found in a load testing environment:

- target machine that hosts the application under test


- master load testing server (load controller): generates the load requests that either send them directly to the target machine or sends them to the slave load testing servers


- slave load testing servers (load generator): get the web requests from the master load testing server and send them to the target machine


Load Runner environment: master (controller) server, slave (load generators) servers, target servers


Finally, a bit of Http protocol theory is needed to explain briefly the concept of http transaction, request, response header and response body.


  • HTTP uses the client-server model: An HTTP client opens a connection and sends a request message to an HTTP server; the server then returns a response message, usually containing the resource that was requested. After delivering the response, the server closes the connection (making HTTP a stateless protocol, i.e. not maintaining any connection information between transactions).
  • The format of the request and response messages are similar, and English-oriented. Both kinds of messages consist of:

    • an initial line,
    • zero or more header lines,
    • a blank line (i.e. a CRLF by itself), and
    • an optional message body (e.g. a file, or query data, or query output).
  • Put another way, the format of an HTTP message is:
       <initial line, different for request vs. response>
       Header1: value1
       Header2: value2
       Header3: value3

       <optional message body goes here, like file contents or query data;
      it can be many lines long, or even binary data $&*%@!^$@>

The above info is borrowed from http://www.jmarshall.com/easy/http/
Please read more about the HTTP protocol on the hosting site.


Having discussed about all of the above, we can start looking at JMETER.